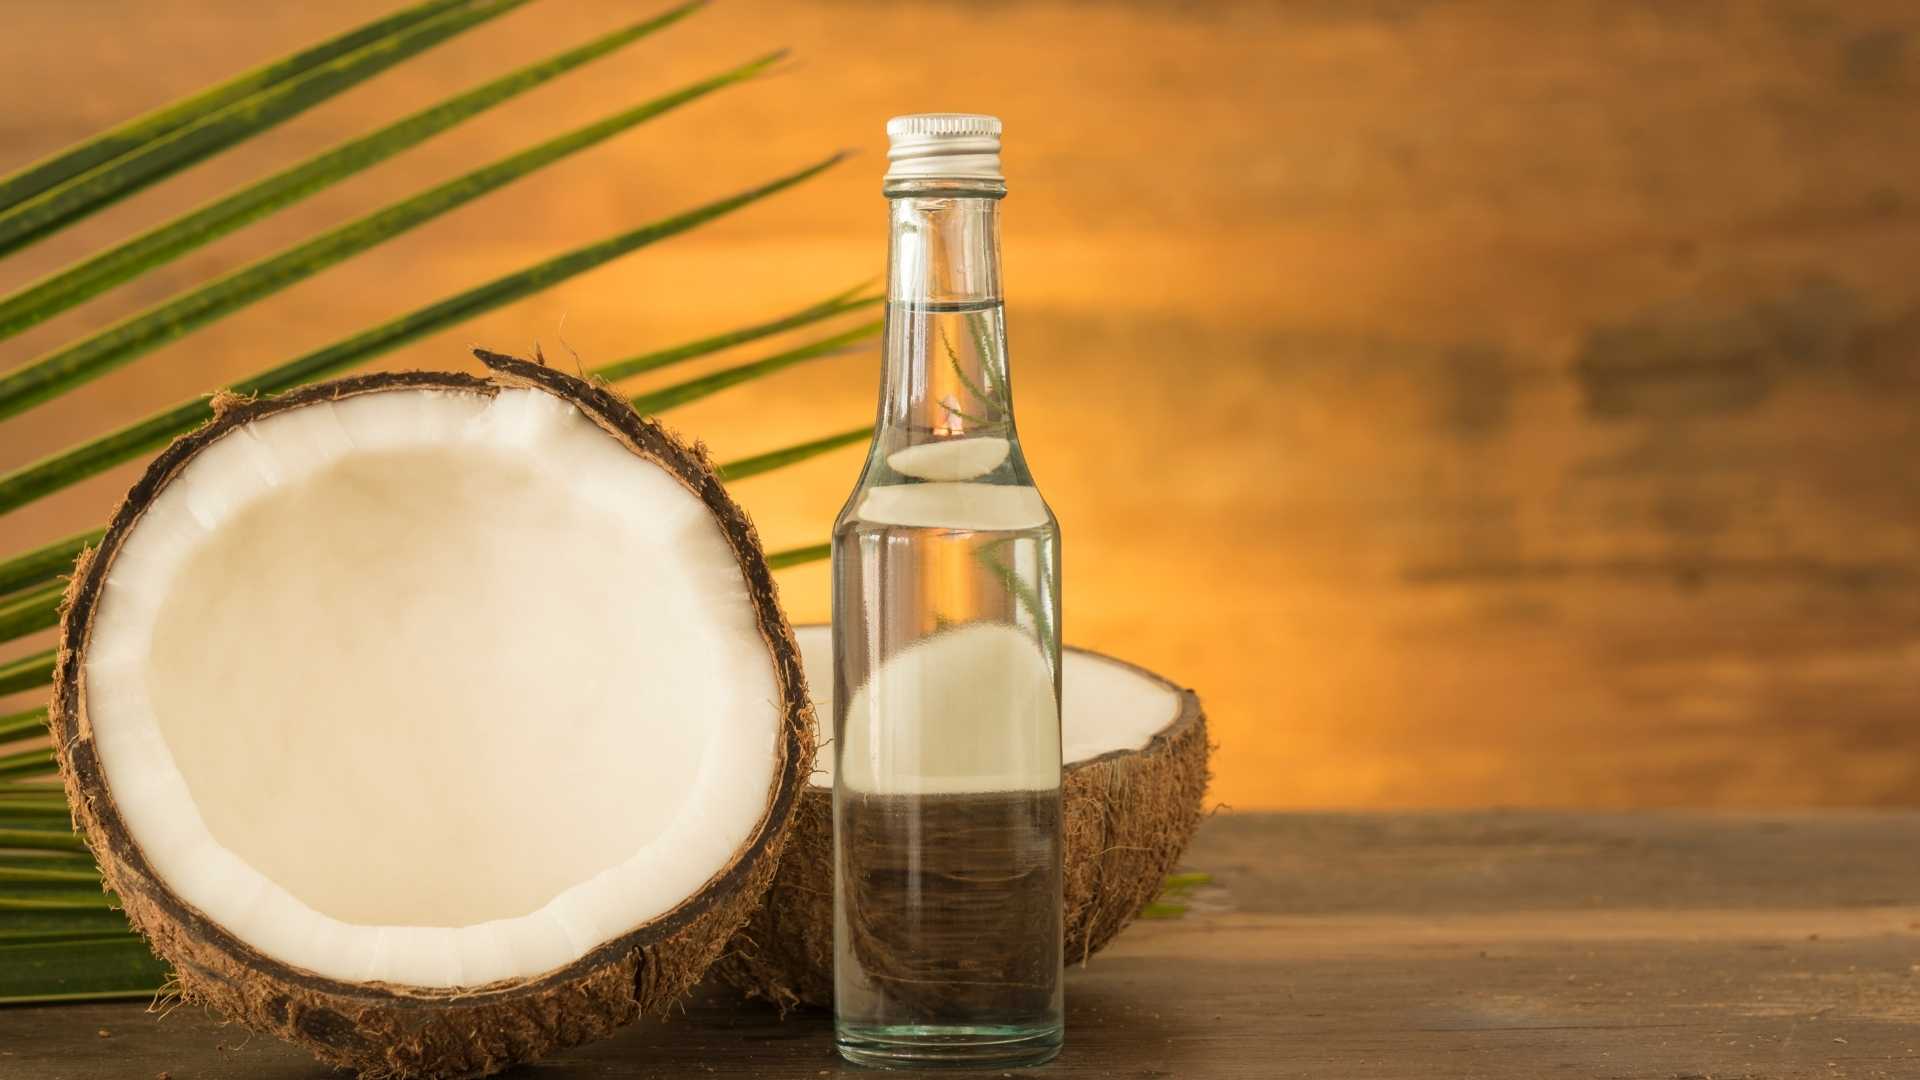
Coconut is an important agricultural product in several coastal states of India. The coconuts, copra and copra or coconut oil are traded within the country as well as exported. Coconut palms are grown or cultivated in India on over 21 lakh hectares (2100000 ha). Based on the area under coconut cultivation, Kerala, Karnataka, Tamil Nadu, Andhra Pradesh (Seemandhra) are the leading coconut cultivation states in India. They are also the largest producers of coconut and downstream products, accounting for more than 90% of coconuts produced in the country. India ranks third in the world in coconut oil production. Over 300000 MT (3 lakh tonnes) of coconut oil were produced in the country in 2018.
Coconut cultivation and production in India has come a long way since its independence in 1947. In 1950-51, India had 626500 ha (6.265 lakh ha) of land under coconut palm cultivation, producing over 3281.7 million coconuts. The coconut productivity at that time was 5238 nuts/ha. After seventy years, in the year 2019-20, India has 2173280 ha (21.7328 lakh ha) of land under coconut cultivation; and increase of almost 3.5 times. Coconuts production in 2019-20 reached 20308.70 million nuts, more than six-fold increase over the year 1950-51. The productivity has also improved to 9345 in 2019-20, an increase of 1.78 times over that of 1950-51.
The following table lists Indian state-wise area under coconut cultivation, coconuts production and productivity for the years 2018-19 and 2019-20.
TABLE 1: INDIAN STATE-WISE COCONUT AREA, PRODUCTION AND PRODUCTIVITY (2018-20)
| STATE | AREA,
‘000 ha |
PRODUCTION,
million nuts |
PRODUCTIVITY,
nuts/ha |
|||
| 2018-19 | 2019-20 | 2018-19 | 2019-20 | 2018-19 | 2019-20 | |
| Andhra Pradesh | 111.82 | 111.38 | 1567.60 | 1555.82 | 14019 | 13969 |
| Arunachal Pradesh | 0.07 | 0.07 | 0.30 | 0.30 | 4615 | 4605 |
| Assam | 20.61 | 20.75 | 182.78 | 159.87 | 8868 | 7704 |
| Bihar | 11.92 | 12.16 | 78.12 | 78.39 | 6551 | 6444 |
| Chhattisgarh | 1.52 | 1.58 | 10.93 | 9.6 | 7210 | 6110 |
| Gujarat | 26.91 | 27.40 | 259.57 | 264.88 | 9646 | 9667 |
| Karnataka | 619.78 | 624 | 4947.74 | 4300.69 | 7983 | 6892 |
| Kerala | 760.95 | 760.78 | 7683.55 | 6980.30 | 10097 | 9175 |
| Maharashtra | 27.18 | 29.95 | 208.93 | 523.66 | 7687 | 17485 |
| Mizoram | 0.03 | 0.03 | 0.15 | 0.15 | 5000 | 4350 |
| Nagaland | 1.06 | 1.06 | 9.02 | 9.02 | 8477 | 8482 |
| Odisha | 46.67 | 51.71 | 286.20 | 354.57 | 6132 | 6857 |
| Others | 49.56 | 58.37 | 274.83 | 292.80 | 5545 | 5017 |
| Tamil Nadu | 436.94 | 437.57 | 5370.39 | 5373.21 | 12291 | 12280 |
| Telangana | 0.46 | 0.53 | 5.59 | 6.49 | 12232 | 12330 |
| Tripura | 4.61 | 4.61 | 18.37 | 18.43 | 3987 | 3996 |
| West Bengal | 30.82 | 31.30 | 384.17 | 389.16 | 12467 | 12433 |
| TOTAL | 2150.89 | 2173.28 | 21288.24 | 20308.70 | 9897 | 9345 |
[Source – Ministry of Agriculture, Govt. of India]
As can be seen from the above table, three states – Kerala, Karnataka, Tamil Nadu – have the highest area under coconut cultivation. They are also the top three producers of coconut in the country. But, their productivity is not the highest as compared to some other states.
However, the total productivity in India is higher than the world’s top producers of coconut, Philippines and Indonesia. In the year 2016, for which the data are available, Philippines had an area of 3565000 ha under cultivation and produced 13825 million coconuts, resulting in the productivity of 3878 coconuts per hectare. Indonesia, another leading coconut producer, cultivated coconut palm on 3441000 ha in 2016 and produced 13934 million coconuts, resulting in the productivity of 4049 coconuts per hectare. During the same year (2015-16), India had 2088470 ha of land under coconut cultivation and produced over 22167 million coconuts, resulting in the productivity of 10614 coconuts per hectare. Thus, India has the highest coconut productivity among the coconut-producing countries in the world.
The following table presents all India area under coconut cultivation, coconut production and productivity for the past several years.
TABLE 2: ALL INDIA COCONUT AREA, PRODUCTION AND PRODUCTIVITY (2011-12 To 2019-20)
| YEARS | AREA, ‘000ha | PRODUCTION, million nuts | PRODUCTIVTY, nuts/ha |
| 2011-12 | 2070.70 | 23351.22 | 11277 |
| 2012-13 | 2136.67 | 22680.03 | 10615 |
| 2013-14 | 2140.50 | 21665.19 | 10122 |
| 2014-15 | 1975.81 | 20439.61 | 10345 |
| 2015-16 | 2088.47 | 22167.45 | 10614 |
| 2016-17 | 2082.11 | 23904.10 | 11481 |
| 2017-18 | 2096.72 | 23798.23 | 11350 |
| 2018-19 | 2150.89 | 21288.24 | 9897 |
| 2019-20 | 2173.28 | 20308.70 | 9345 |
[Source – Coconut Development Board, Ministry of Agriculture, Govt. of India]
As mentioned earlier, India produces coconuts and many downstream products which are consumed within the country as well as exported. The following table lists most of these products along with their description and HS Codes used for international trade.
TABLE 3: COCONUTS AND DOWNSTREAM PRODUCTS AND THEIR HS CODES
| PRODUCTS | DESCRIPTION | HS CODES |
| Coconuts | Nuts, edible; coconuts, fresh or dried, whether or shelled or peeled |
080110 |
| Desiccated coconuts | Nuts, edible; coconuts, fresh or dried, whether or not shelled or peeled, desiccated | 080111 |
| Copra | Nuts, edible; coconuts, in the inner shell (endocarp) | 080112 |
| Coconuts, other than desiccated | Nuts, edible; coconuts, fresh or dried, whether or not shelled or peeled, other than desiccated | 080119 |
| Crude coconut oil and its fractions | Vegetable oils; coconut (copra) oil and its fractions, crude, not chemically modified |
151311 |
| Coconut oil and its fractions, other than crude |
Vegetable oils; coconut (copra) oil and its fractions, other than crude, whether or not refined, but not chemically modified | 151319 |
| Copra cake (meal) | Oil-cake and other solid residues; whether or not ground or in the form of pellets, resulting from the extraction of coconut or copra seed oils |
230650 |
| Raw coconut coir | Coconut (coir); raw , but not spun | 530511 |
| Coconut coir processed but not spun, including yarn waste |
Coconut (coir); processed (but not spun), tow, noils and waste, including yarn waste and garnetted stock |
530519 |
| Woven carpets, whether or not made up of coconut fibers (coir) | Carpets and other textile floor coverings; woven (not tufted or flocked), whether or not made up of coconut fibers (coir) | 570220 |
[Source – UN Comtrade Database]
It must be noted here that the HS Code 570220 includes carpets made from coconut fibers or coir as well as other materials.
The wide variety of products made from coconuts which are traded internationally, can be seen from the above table. However, not all these products are made in India and / or exported. Some of these products may be produced in India but are consumed within the country and not exported.
Products made from coconuts exported from India are listed in the table below along with their estimated export quantities and values for the past three years.
In the year 2020, exports of copra, coconut oil and its fractions (crude and other than crude) increased substantially as compared to the previous two years, 2018 and 2019. However, copra cake and woven carpets exports decreased to some extent in 2020 as compared to 2019.
Although over 300000 MT of coconut (copra) oil was produced in India during 2018, only small quantities of coconut oil were exported from the country, indicating that most of the coconut oil produced in the country was consumed in domestic markets, either directly or after conversion to other products.
India exports many coconut products and also imports several coconut products from other global producers. The following table presents a comparison of export value and import value of all coconut products for the past several years.
TABLE 4: EXPORT AND IMPORT VALUES OF COCONUT AND ITS PRODUCTS
| YEARS | EXPORT VALUE, Rs. crores | IMPORT VALUE, Rs. crores |
| 2015-16 | 1450.24 | 380.02 |
| 2016-17 | 2061.70 | 270.59 |
| 2017-18 | 1764.31 | 369.36 |
| 2018-19 | 2045.36 | 597.58 |
| 2019-20 | 1762.17 | 802.64 |
| 2020-21 | 2294.81 | 744.25 |
[Source – Coconut Development Board, Ministry of Agriculture, Govt. of India]
PRICES
Kerala state in India is a leading producer of coconuts, coconut oil and their products. Latest prices of various coconut products are reported daily from the markets located at several district places in the state. These prices are available through the website of Coconut Development Board. Prices of major coconut products as reported on 24 December 2021 are presented in the following table. Most of these commodity prices are reported as Rs. per quintal, i.e., per 100 kg. These prices are listed in the following table on per kg basis for convenience.
TABLE 5: PRICES OF COCONUT PRODUCTS IN INDIA
| COCONUT PRODUCTS | PRICE RANGES, Rs. per kg |
| Coconuts | 30 to 31.50 |
| Copra | 99 to 107.50 |
| Coconut oil | 147.33 to 175.00 |
| Desiccated coconut | 158 to 160 |
[Source – Coconut Development Board]
You might find these interesting:
Understand the production process of virgin coconut oil
Read about the global commercial aspects of copra or coconut oil production
Learn how virgin coconut oil is extracted - the process and the many methods
For 82 years, Kumar has been delivering dependable process engineering solutions to the oils and fats industry. We're known for our robustly engineered, versatile and operationally profitable plant and machinery. It's why over 500 customers in 65 countries depend on us to solve their processing challenges, big or small. If you’d like to know more about our solutions please fill out the form below:
"*" indicates required fields


Which Indian states. Consuming coconut oil in india?